What the energy price cap really limits, and why bills can still go up
Ofgem’s cap limits unit rates and standing charges, not the total bill. From 1 October 2026 the typical Direct Debit figure is £1,723 a year, but region, payment method and use all change what a household pays.

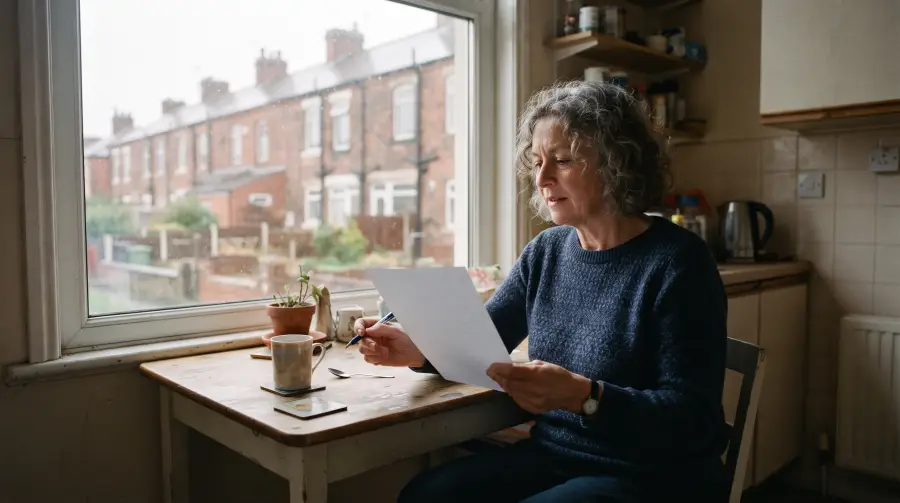
Two neighbours on the same street, both on their supplier’s standard variable tariff, compared their energy bills over the garden fence. Jean, who lives alone in a small terraced house, pays a good deal less than Derek, whose larger house has a family living in it. Both had heard that the energy price cap went up on 1 October, and neither bill matched the national figure in the news. The cap simply does not work the way the headline number suggests.
A cap on prices, not on the bill
The energy price cap is set by Ofgem, the energy regulator for Great Britain. It limits the maximum a supplier can charge for each unit of energy (a kilowatt hour, or kWh) and for the daily standing charge on a standard variable tariff, also called a default tariff. It does not limit the total bill. Ofgem’s own guidance makes the point directly: households that use more energy pay more.
The cap covers standard variable and default tariffs for gas and electricity in England, Scotland and Wales. It does not apply to fixed tariffs, to business contracts, to heat networks or to heating oil. Northern Ireland has a separate energy market and is not covered.
Where the £1,723 figure comes from
For the period from 1 October to 31 December 2026, Ofgem’s headline figure is £1,723 a year. That is up 4%, or £60 a year, from £1,663 in the July to September period. Ofgem announced it on 26 August 2026.
The £1,723 is not a maximum bill. It is what a household with “typical” use would pay over a year at the capped rates, paying by Direct Debit for both gas and electricity. Ofgem’s typical use, updated in 2026, is 2,500 kWh of electricity and 9,500 kWh of gas a year. Ofgem’s summary also gives typical figures by payment method for the same period:
| Ofgem typical annual figures, 1 October to 31 December 2026 | July–Sept 2026 | Oct–Dec 2026 |
|---|---|---|
| Direct Debit | £1,663 | £1,723 |
| Standard credit (paying on receipt of a bill) | £1,796 | £1,861 |
| Prepayment meter | £1,620 | £1,678 |
| Economy 7, Direct Debit | £1,039 | £1,046 |
Source: Ofgem summary of changes, 26 August 2026. Figures are annualised for typical use (2,500 kWh electricity and 9,500 kWh gas; 3,400 kWh for multi-register meters such as Economy 7) and rounded to the nearest pound. They are reference points, not bills.
The rates behind the cap from 1 October 2026
What actually limits a bill is the set of unit rates and standing charges. Ofgem’s average capped figures for Direct Debit customers in England, Scotland and Wales from 1 October to 31 December 2026 are:
- Electricity: 26.32p per kWh, with a daily standing charge of 54.83p.
- Gas: 7.97p per kWh, with a daily standing charge of 29.68p.
Gas figures include VAT at 5%. The electricity figures include no VAT, because the government removed VAT from domestic electricity bills from 1 October 2026. Ofgem said that without that change the rise in the typical figure would have been about £45 higher.
Filled square: the next date. Days are recalculated every day from today’s date; past dates are shown in grey.
Why the same cap gives different bills
The table applies Ofgem’s average Direct Debit rates for October to December 2026 to three invented levels of use, as if those rates applied for a whole year.
| Illustrative example, usage invented | Electricity / gas a year | Annual cost at capped rates |
|---|---|---|
| Jean, small home, low use | 1,800 / 6,000 kWh | about £1,260 |
| Ofgem typical household | 2,500 / 9,500 kWh | about £1,724 |
| Derek, larger home, high use | 3,500 / 13,000 kWh | about £2,266 |
| Standing charges alone, included in every line above | 365 days | about £308 |
Illustrative example. Usage figures for Jean and Derek are invented. Costs use Ofgem’s average Direct Debit rates for 1 October to 31 December 2026, annualised; the typical line differs from Ofgem’s £1,723 only through rounding. Actual rates vary by region, payment method and meter type, and real bills follow the rates in force in each period.
Two things stand out. The standing charges, about £308 a year here, are the same however little energy is used. And because the cap sets the price of each unit, using twice as much energy costs roughly twice as much.
“The cap limits what each unit of energy can cost, not what a household spends in total.”
Region and payment method change the numbers
Ofgem sets cap levels for each region of Great Britain, because the cost of running local networks differs. The averages above are national figures; the rate for any particular postcode can be higher or lower. Ofgem publishes regional unit rates and standing charges on its website.
Payment method matters too. Standard credit customers, who pay after receiving a bill, face a higher cap than Direct Debit customers. For this period, Ofgem said prepayment customers had the lowest cap rates, about £45 a year less than Direct Debit for typical use.
Every three months, set in advance
Ofgem reviews and updates the cap every three months, for the periods starting 1 January, 1 April, 1 July and 1 October. Each new level is published a few weeks before it takes effect; the October 2026 level was published on 26 August 2026.
Wholesale costs drove the October rise: Ofgem’s summary says the wholesale cost allowance rose by 11% and now makes up 47% of the cap, mainly because of instability in the Middle East.
As of 28 October 2026, Ofgem had not published the cap level for 1 January to 31 March 2027. Forecasts from consultancies appear in the news, but they are not Ofgem figures. The confirmed level, and the date it is published, appear on Ofgem’s price cap pages.
Fixed tariffs and the cap
A fixed tariff is outside the cap: its rates stay the same for the length of the deal. Ofgem said that about 35% of households, around 11 million, were on fixed tariffs and so were not affected by the October rise. A fixed deal can cost more or less than the cap over its term, depending on how the cap moves, and many charge a fee for leaving early. When a fixed deal ends without a new one, the household normally moves onto a standard variable tariff, which the cap covers.
Who this matters for, and what to check
The cap matters most to households on a standard variable tariff, people on fixed incomes planning winter costs, and anyone whose bill does not match the national figure.
- The tariff name, and whether it is a fixed or standard variable tariff.
- The unit rate and standing charge for each fuel, to compare with Ofgem’s regional figures.
- Annual use in kWh, often shown as an estimate for the next twelve months.
- The payment method, since Direct Debit, standard credit and prepayment are capped at different levels.
- For a fixed deal, the end date and any exit fee.
Any change of tariff or supplier is arranged directly with a supplier; this website does not sell energy or take applications.
What the headline number really means
The £1,723 figure is a reference point for comparing one period with the next, not anyone’s bill. Each household pays the capped rates for its region and payment method, multiplied by the energy it uses, plus the standing charges. The main article sets out the current State Pension weekly rates; help with other household costs is covered in Council Tax Reduction on a lower income and, for adapted heating controls, the guide to Disabled Facilities Grants.
Official sources
- Ofgem — Energy price cap · What the cap covers and does not cover; reviewed every three months; variation by region, payment method and meter
- Ofgem — Energy price cap unit rates and standing charges · Average Direct Debit unit rates and standing charges for 1 October to 31 December 2026; VAT treatment
- Ofgem — Summary of changes to energy price cap, 1 October to 31 December 2026 · Typical figures by payment method, typical consumption values, wholesale cost drivers; dated 26 August 2026
- Ofgem — Energy price cap will rise by 4% from October 2026 · The £60 rise to £1,723, VAT change on electricity, prepayment comparison and households on fixed tariffs
This is private, sponsored general information from B.B.R. Finance OÜ on thepowertodomore.com. It is not a communication from the Department for Work and Pensions (DWP), the Pension Service or HM Revenue & Customs (HMRC), and this website is not affiliated with them or with any other government body. It is not personal financial, tax or legal advice. Amounts and examples are illustrations, not a promise of any payment, refund or saving; they were checked on against the official sources listed and can change. This website takes no applications, arranges no products and charges no fees. Never give your National Insurance number, bank details or Government Gateway / GOV.UK One Login credentials to a website because you have read an article. For your own State Pension, tax or benefits, use the official services on GOV.UK.
 THE MONEY DIARY
A short email on Monday: which tax, banking and household dates are coming up, what has changed and one rule explained with its official source. Free, and you can unsubscribe at any time.
 HOUSEHOLD

 PENSIONS & PAYMENTS